




|
|
|
These are the pages relevant to the topic of factor analysis: Regression. Introduction to principal components analysis. This page, Orthogonal factor rotation. Oblique rotation. Full factor extraction. Principle Axes extraction. Cluster analysis.
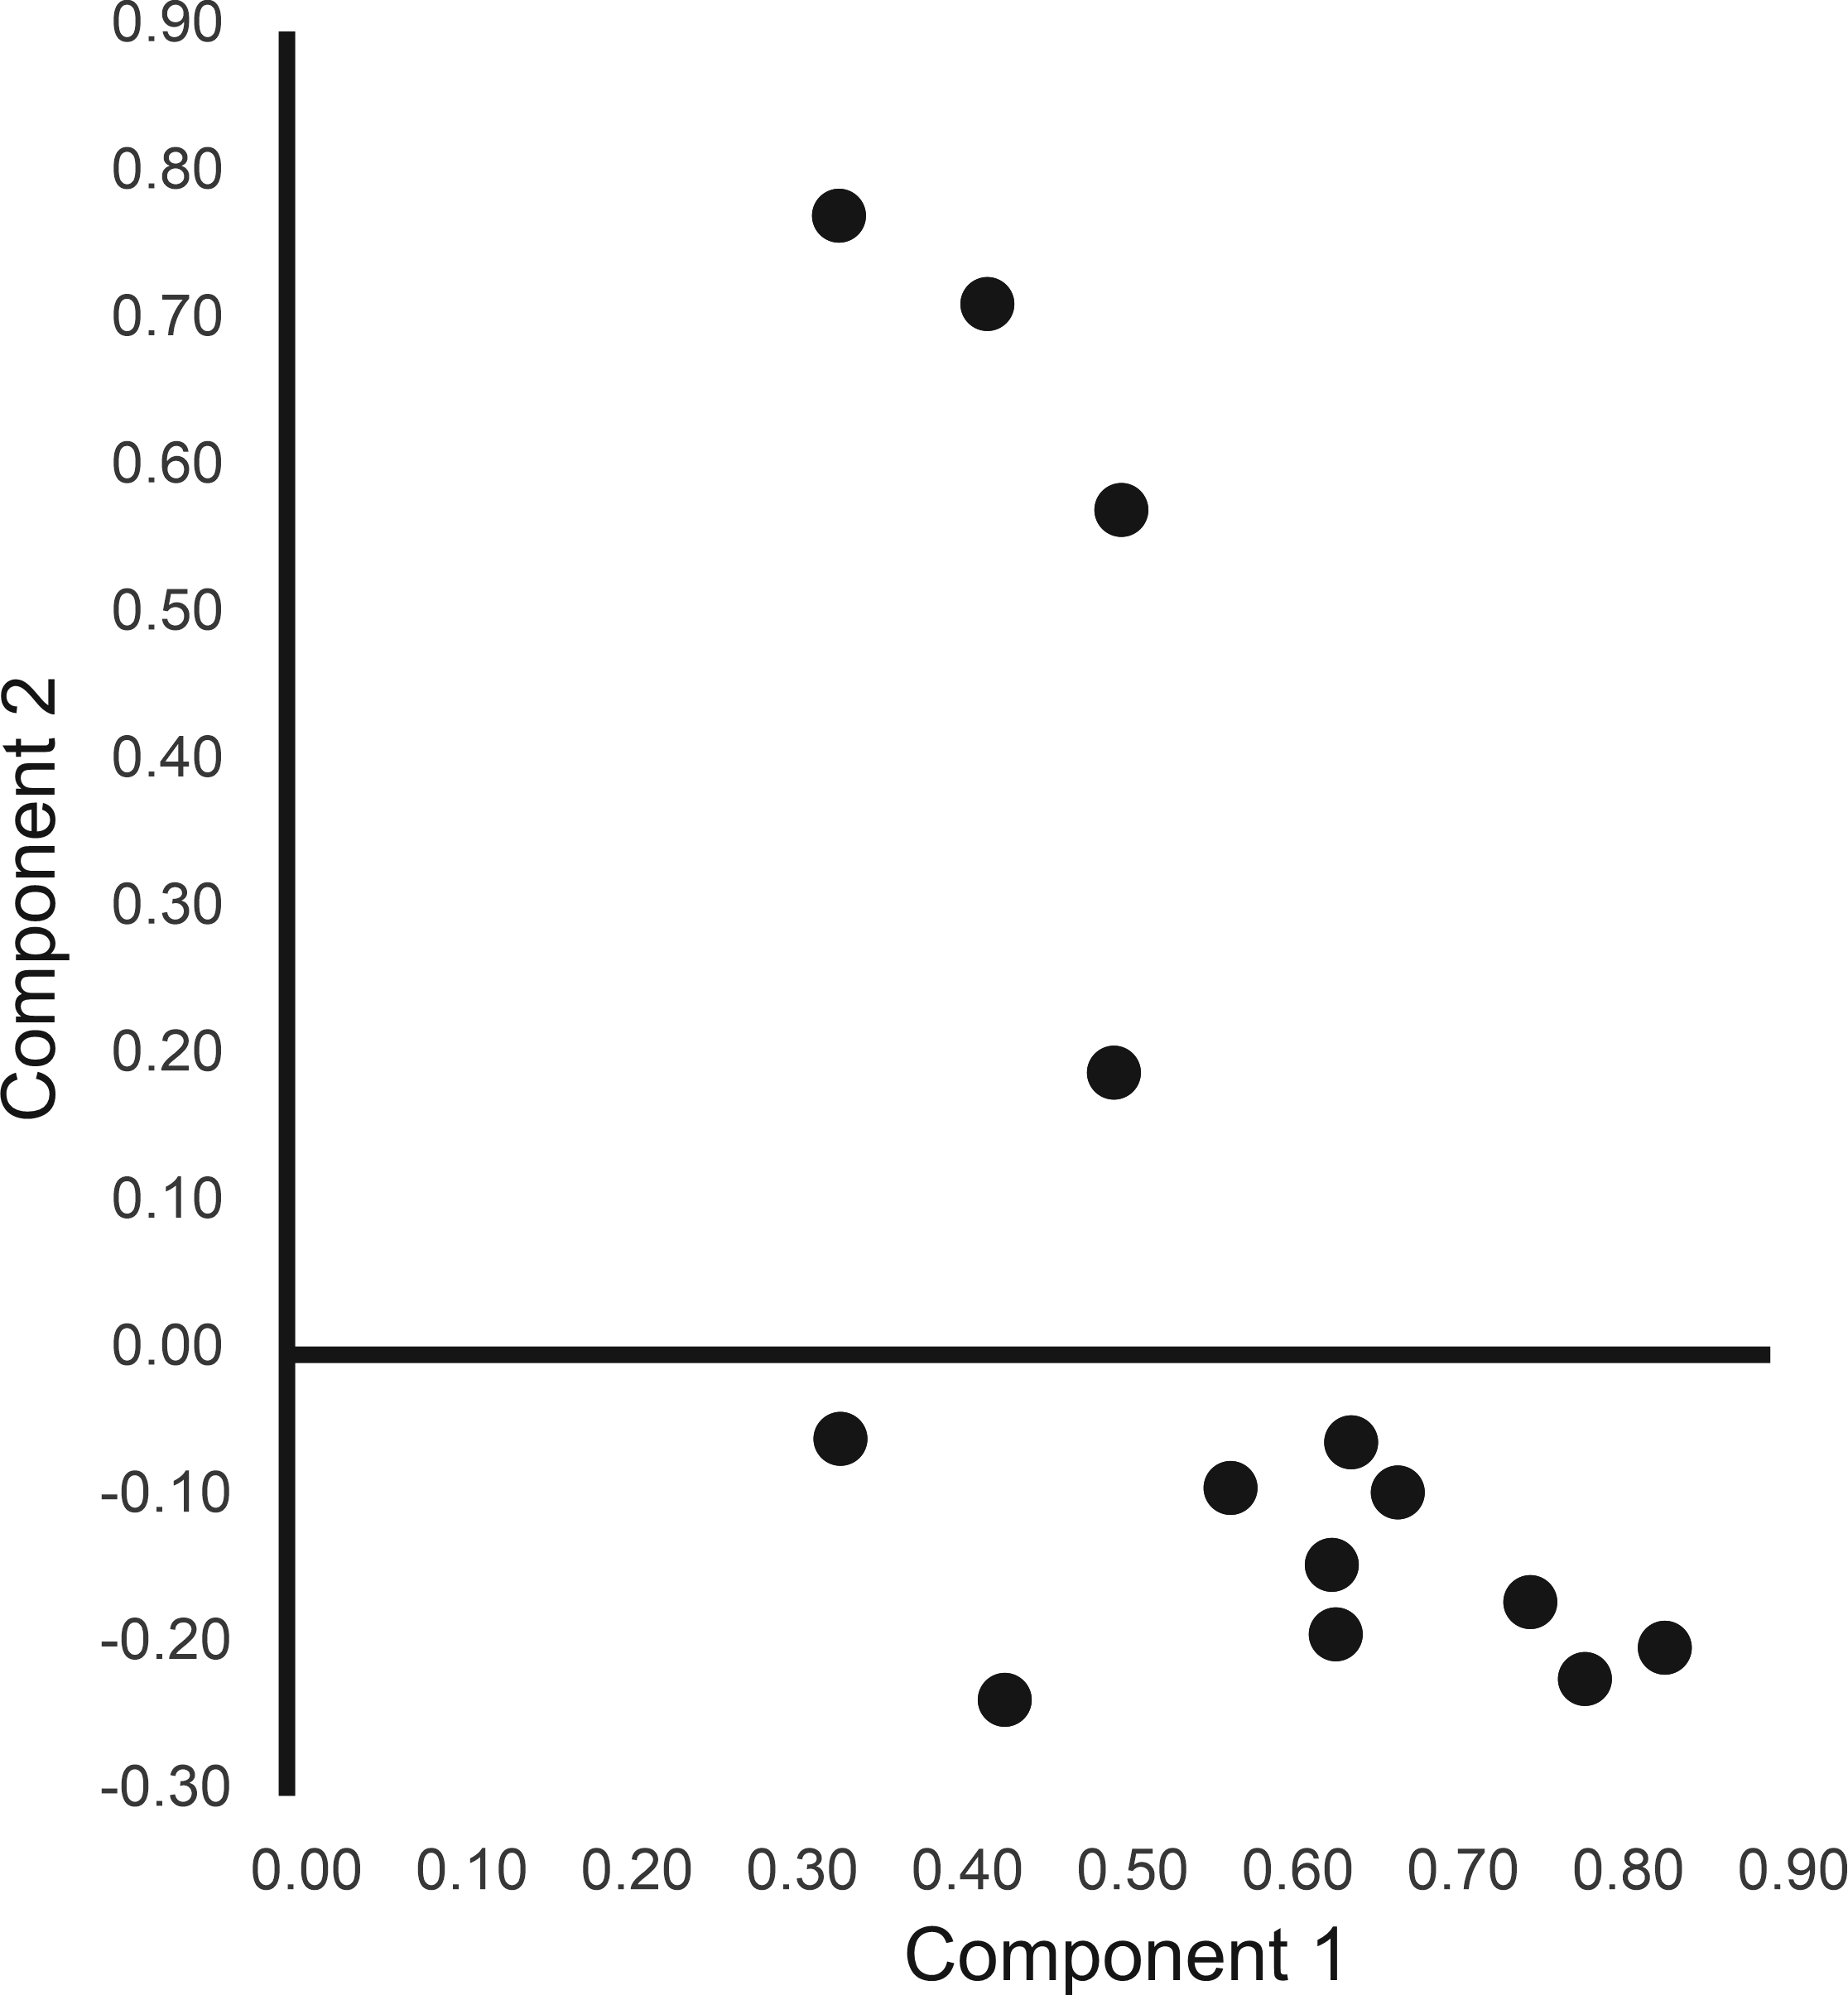
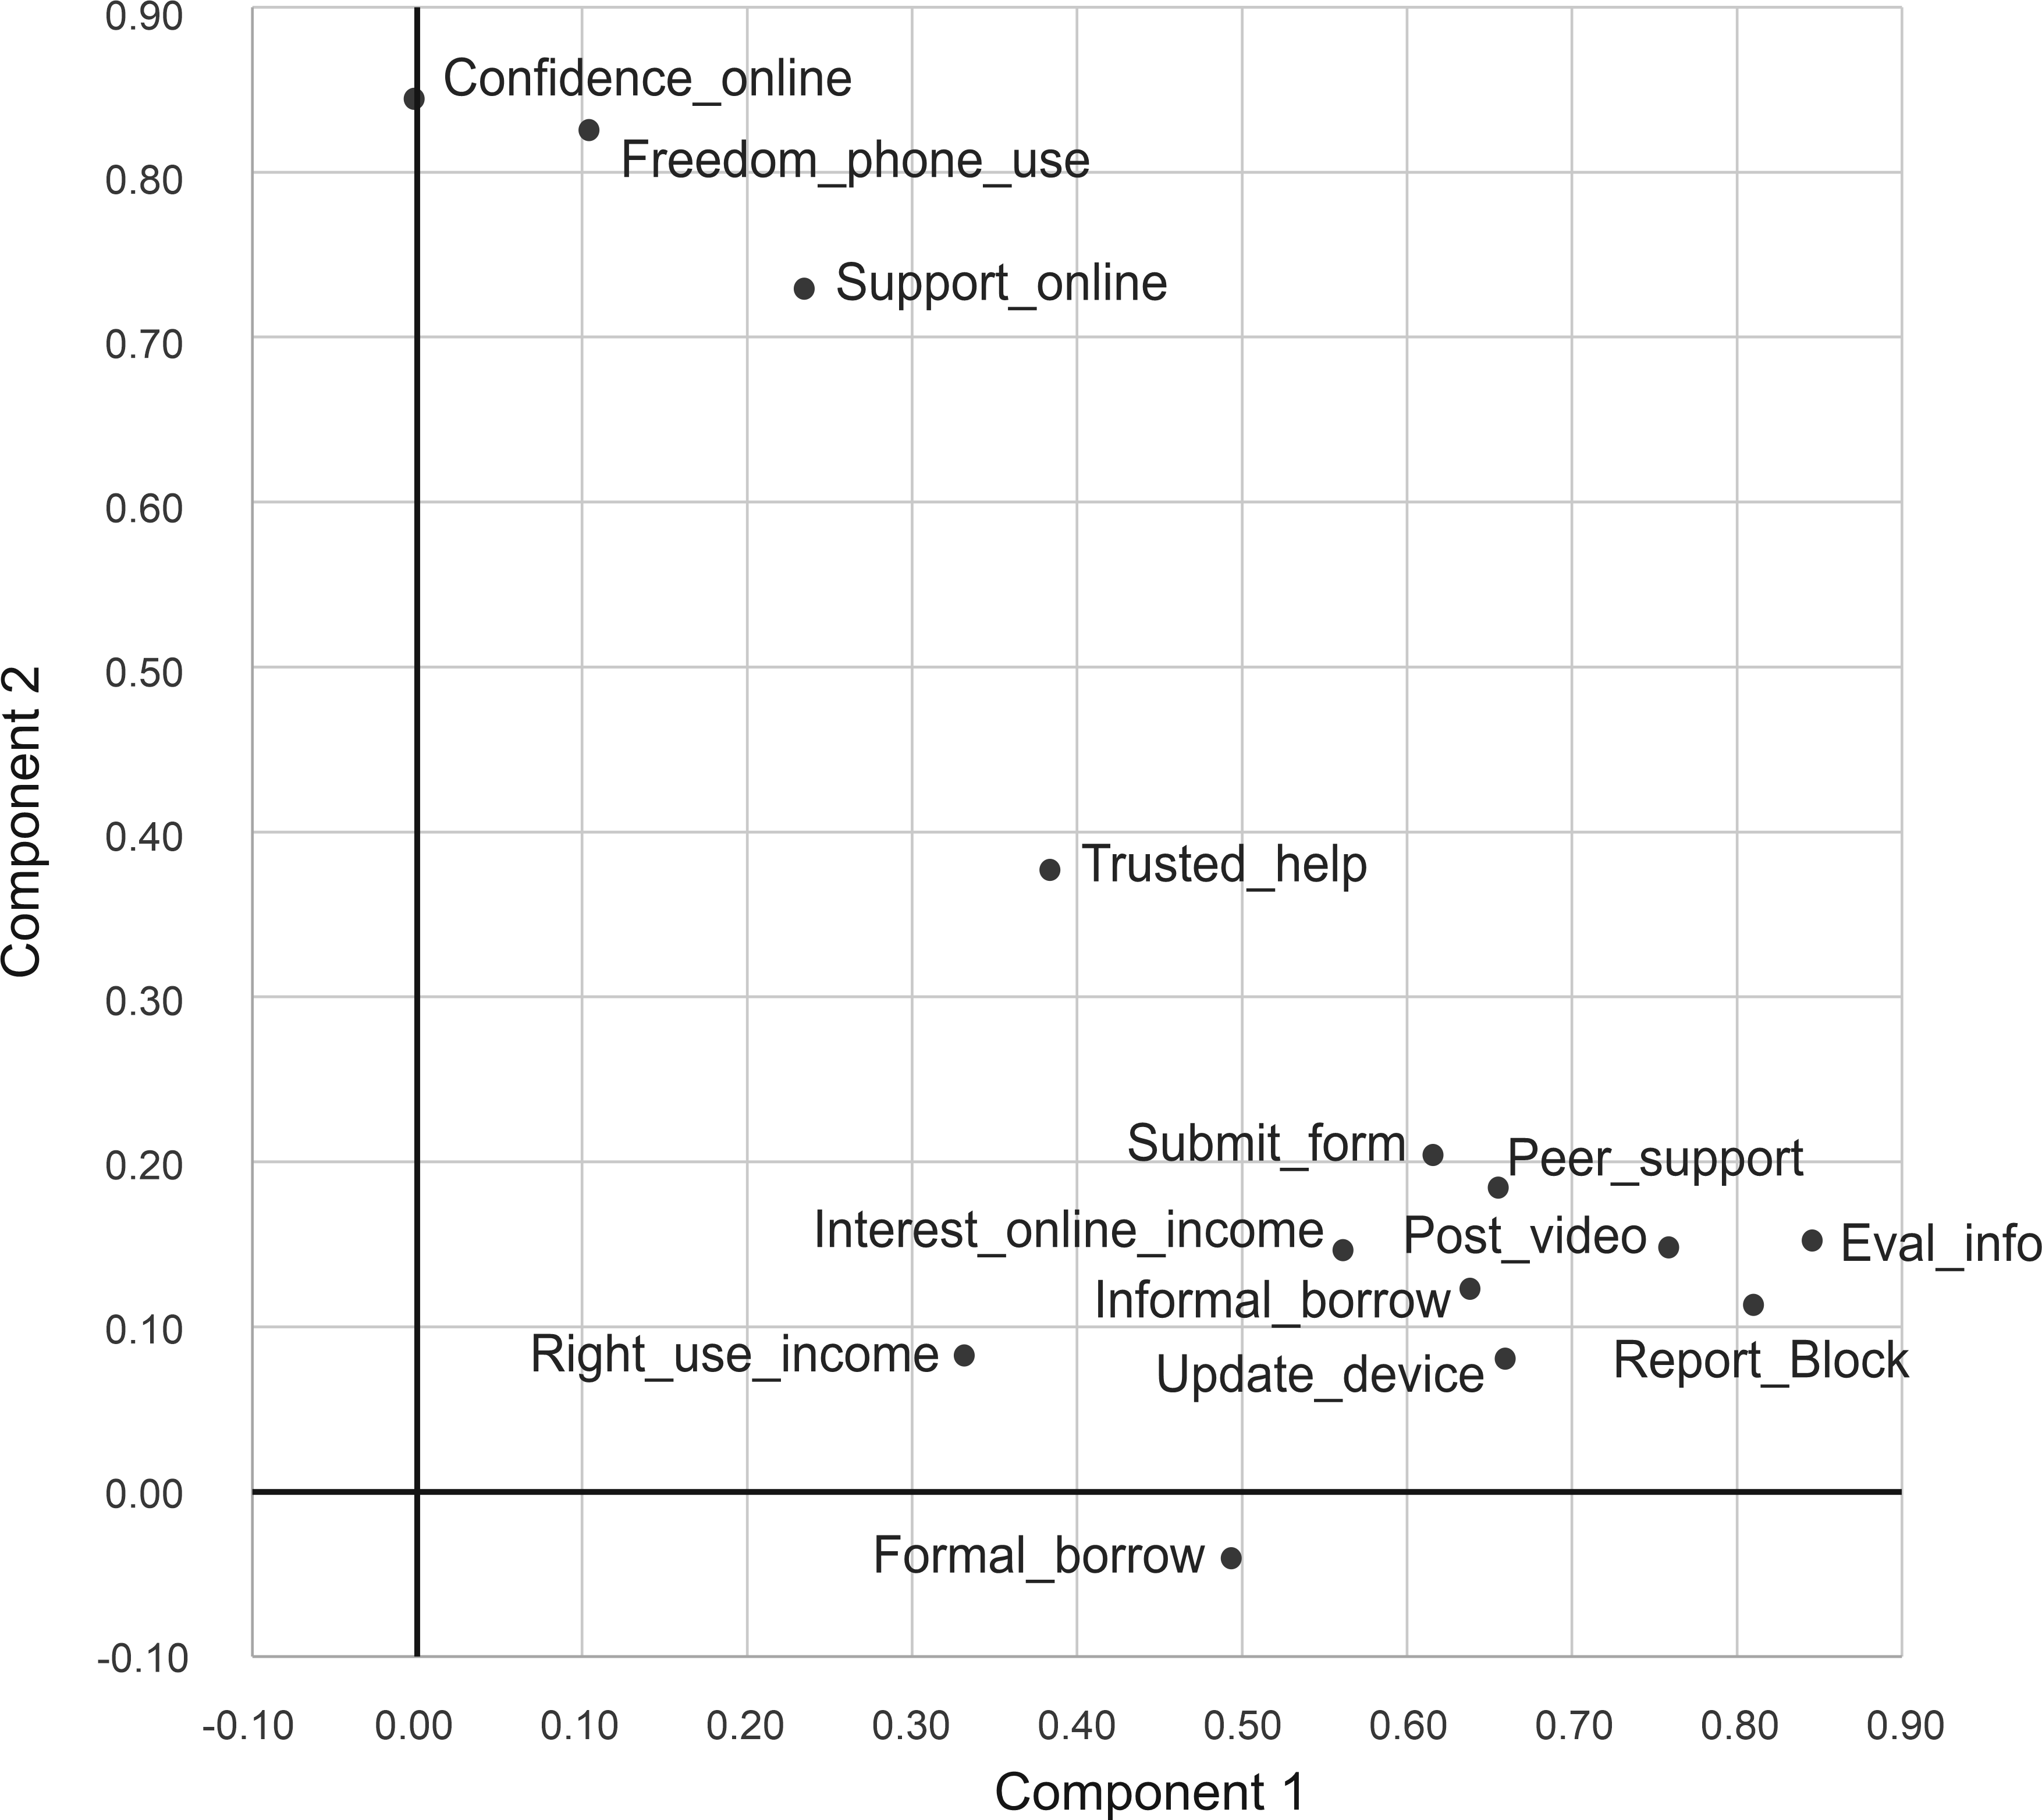
Factor analysis: Introduction to rotationFrom our introduction to PCA, we have extracted two components from the correlation matrix, and their loadings are illustrated in the plot of Figure 1. We previously agreed that these two components had non-obvious interpretations. Part of the difficulty is due to the variables not clearly clustering on one or other component.
Figure 1. Un-annotated loadings plot of Components 1 and 2
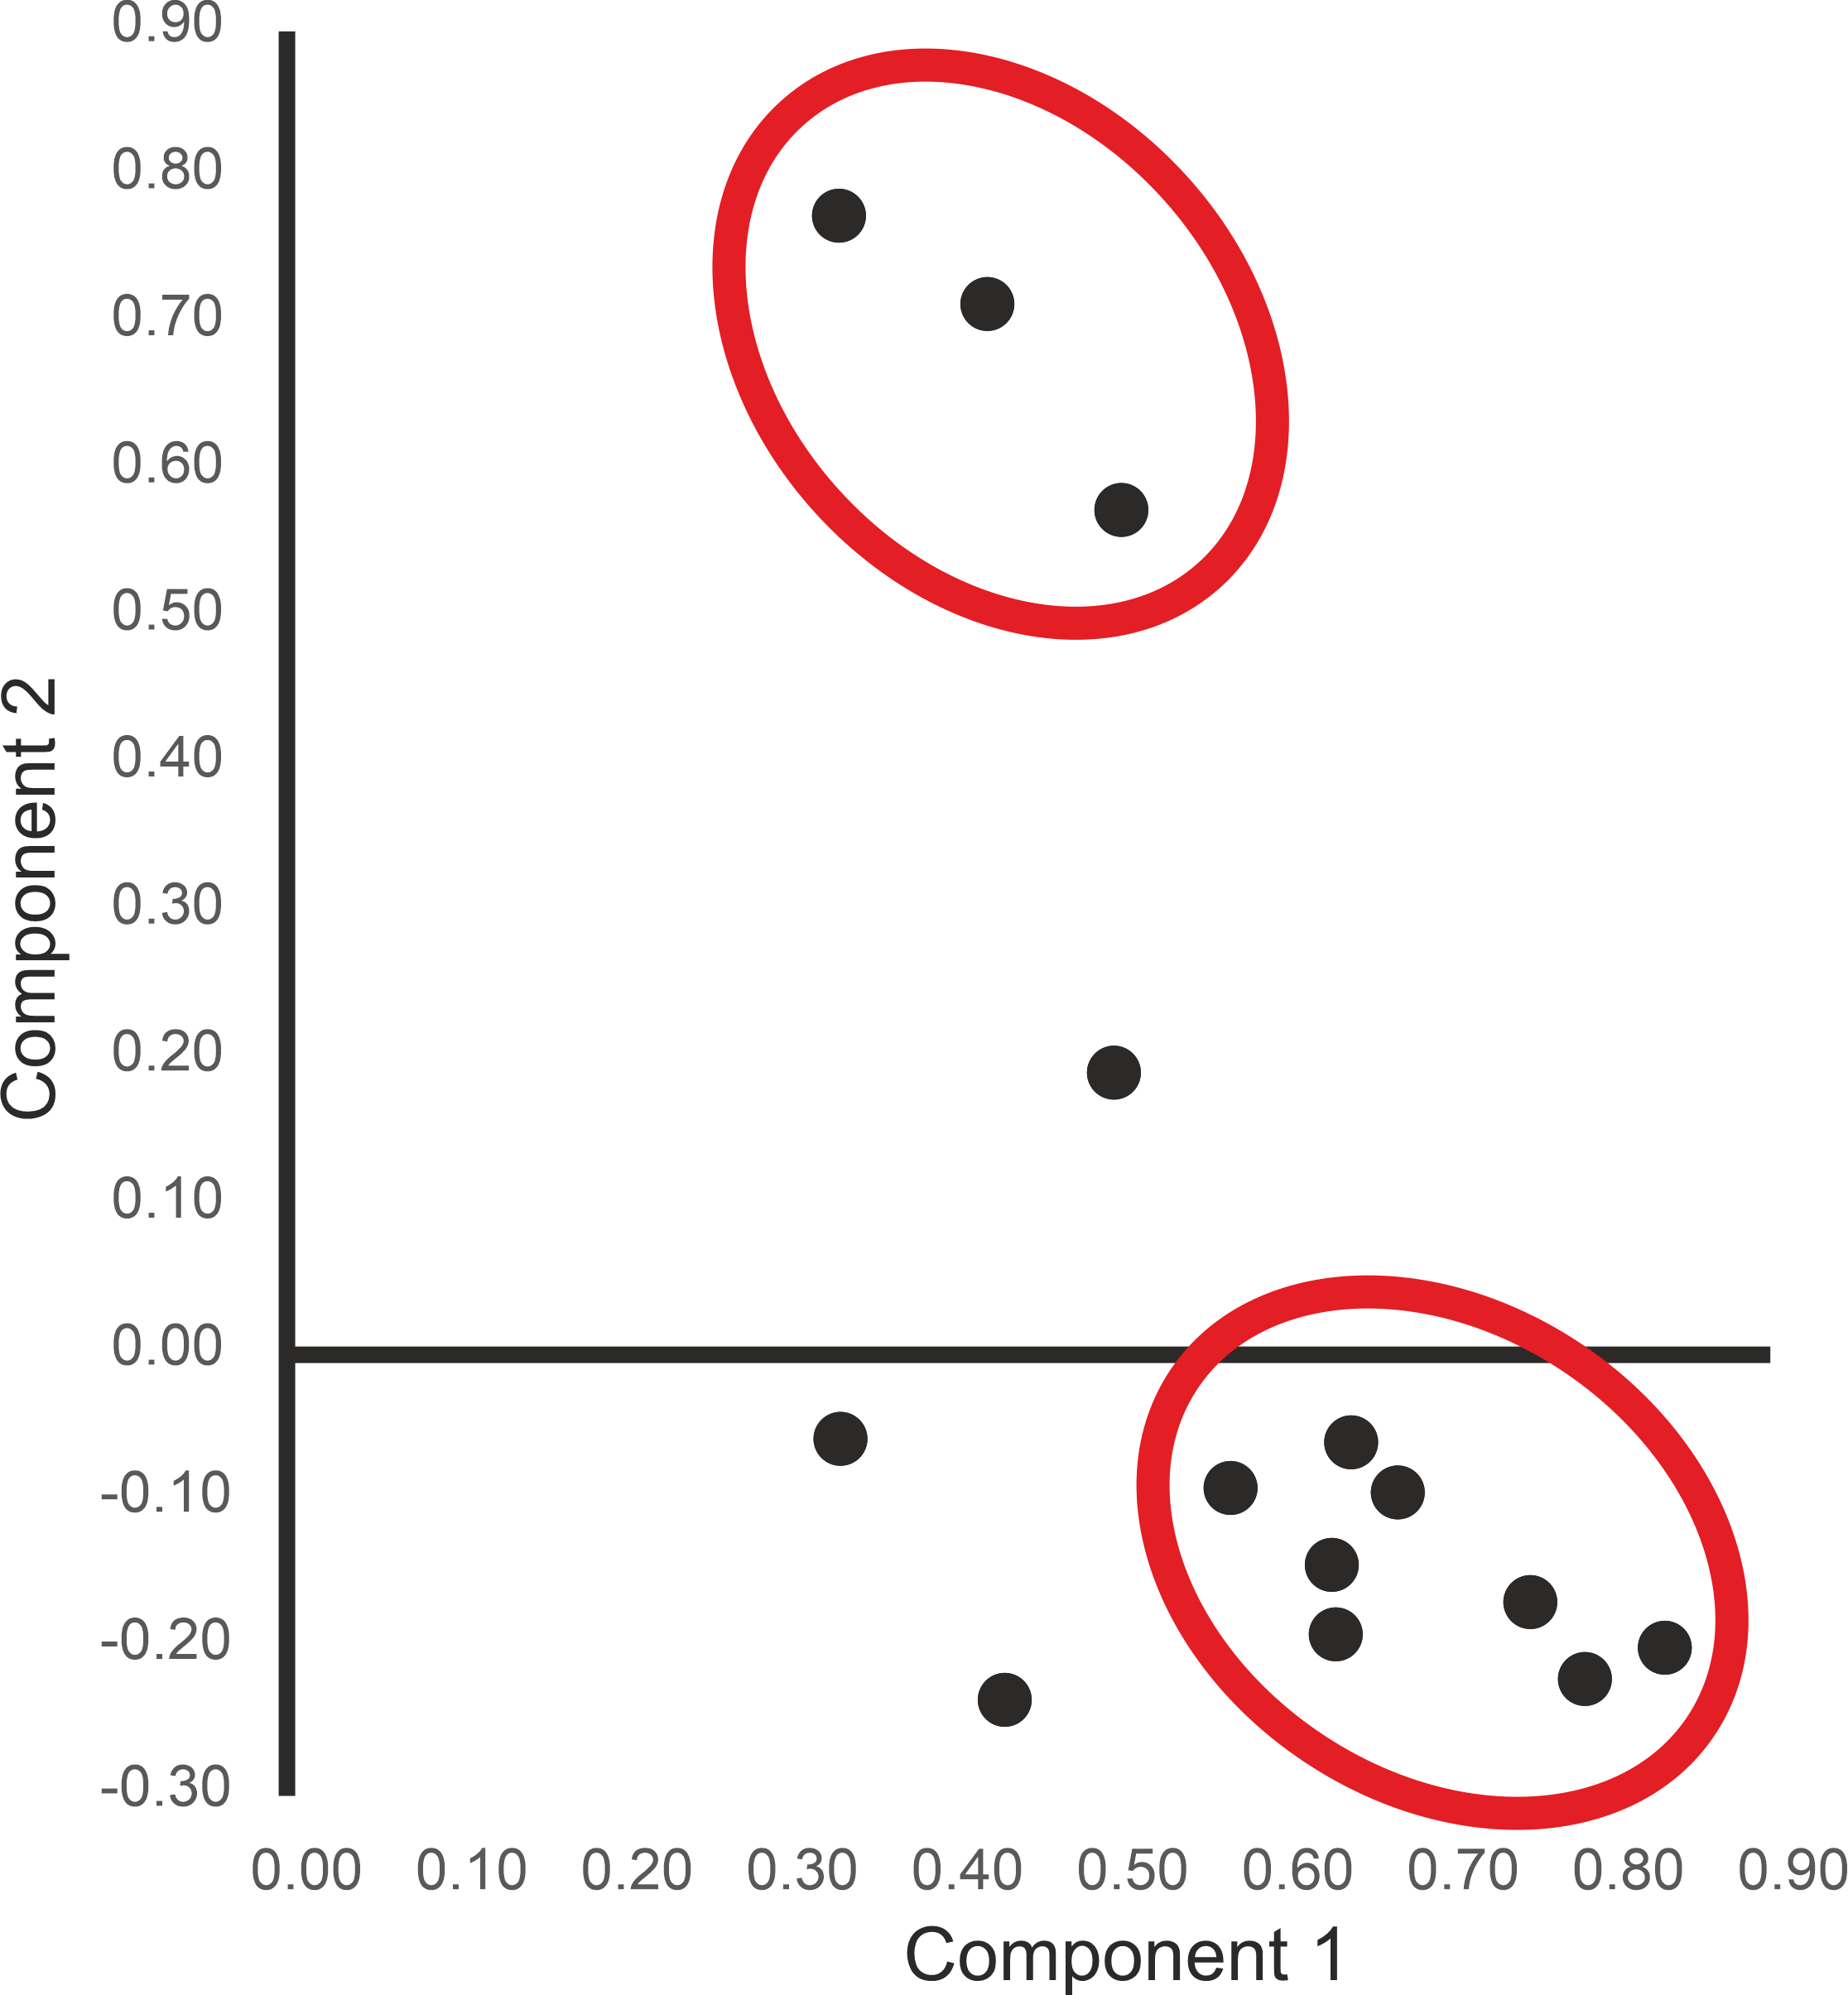
We consider Figure 1 and may think that we can see two clusters of variables, as in Figure 2. It would be helpful if we could rotate the component axes so that each cluster clearly "sat" on a component.
Figure 2. Two possible clusters
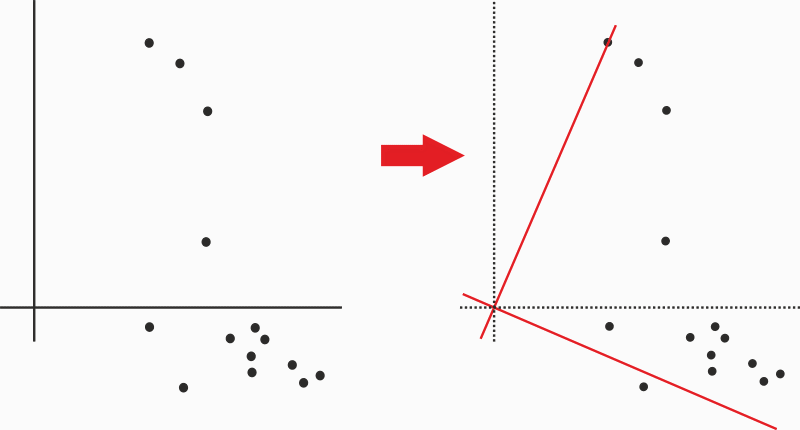
Figure 3 illustrates the start of the rotation we have in mind. Given the loadings plot of the two extracted components on the left, we rotate the axes as best we can to have each axis on or near a cluster. Our constraint is that the axes remain at right angles so that the components retain their property of being independent and uncorrelated.
Figure 3. Rotating the component axes to better intersect clusters of variables
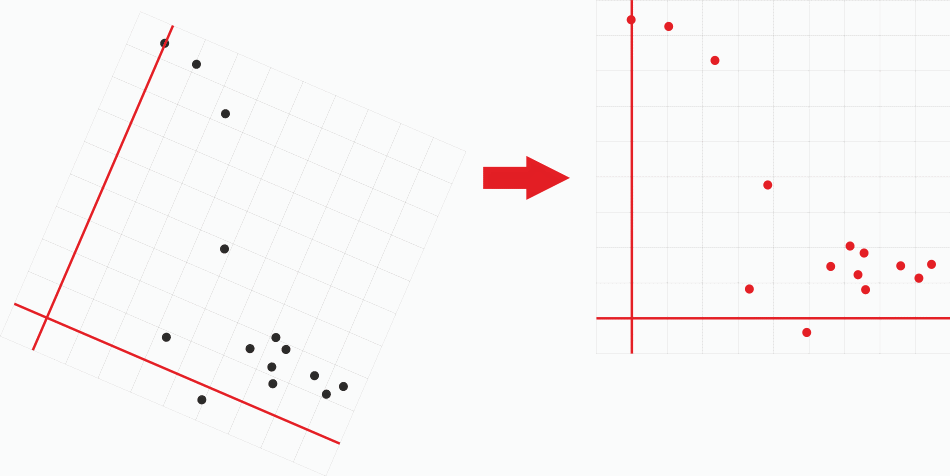
Then we show the rotation plot from Figure 3 being presented in a conventional Cartesian orientation, as in the right-hand plot of Figure 4.
Figure 4. Presenting the rotated axes in conventional Cartesian orientation
Orthogonal rotationThis is exactly what SPSS (or your statistics software of choice) does when you ask for an orthogonal rotation. The output, the rotated component matrix, is shown in Table 1 and the annotated component plot in rotated space is shown in Figure 5.
Table 1. Rotated component matrix
Figure 5. Component plot in rotated space
Is it acceptable to "rotate the component axes" so as to get a better picture of the clusters of variables; isn't that somewhat arbitrary? Well, we remember that a component is a hypothetical variable, accounting for as much variance in the correlation matrix that is not accounted for by any other component. After rotation, our hypothetical variable, a component, still accounts for variation not accounted for by any other hypothetical variables, ie other components. What we have done is re-allocate variance accounted for from one component to another. This is shown in Table 2.
Table 2. Total variance explained
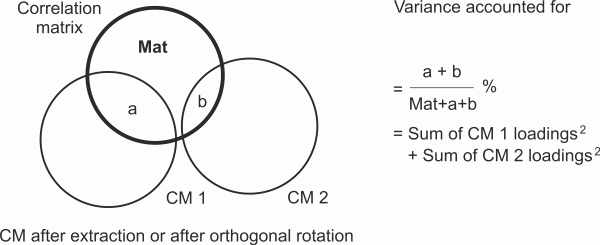
It may be useful to illustrate the variance accounted for in a Venn diagram, Figure 6.
Figure 6. Venn diagram of variance accounted for in the correlation matrix by orthogonal components
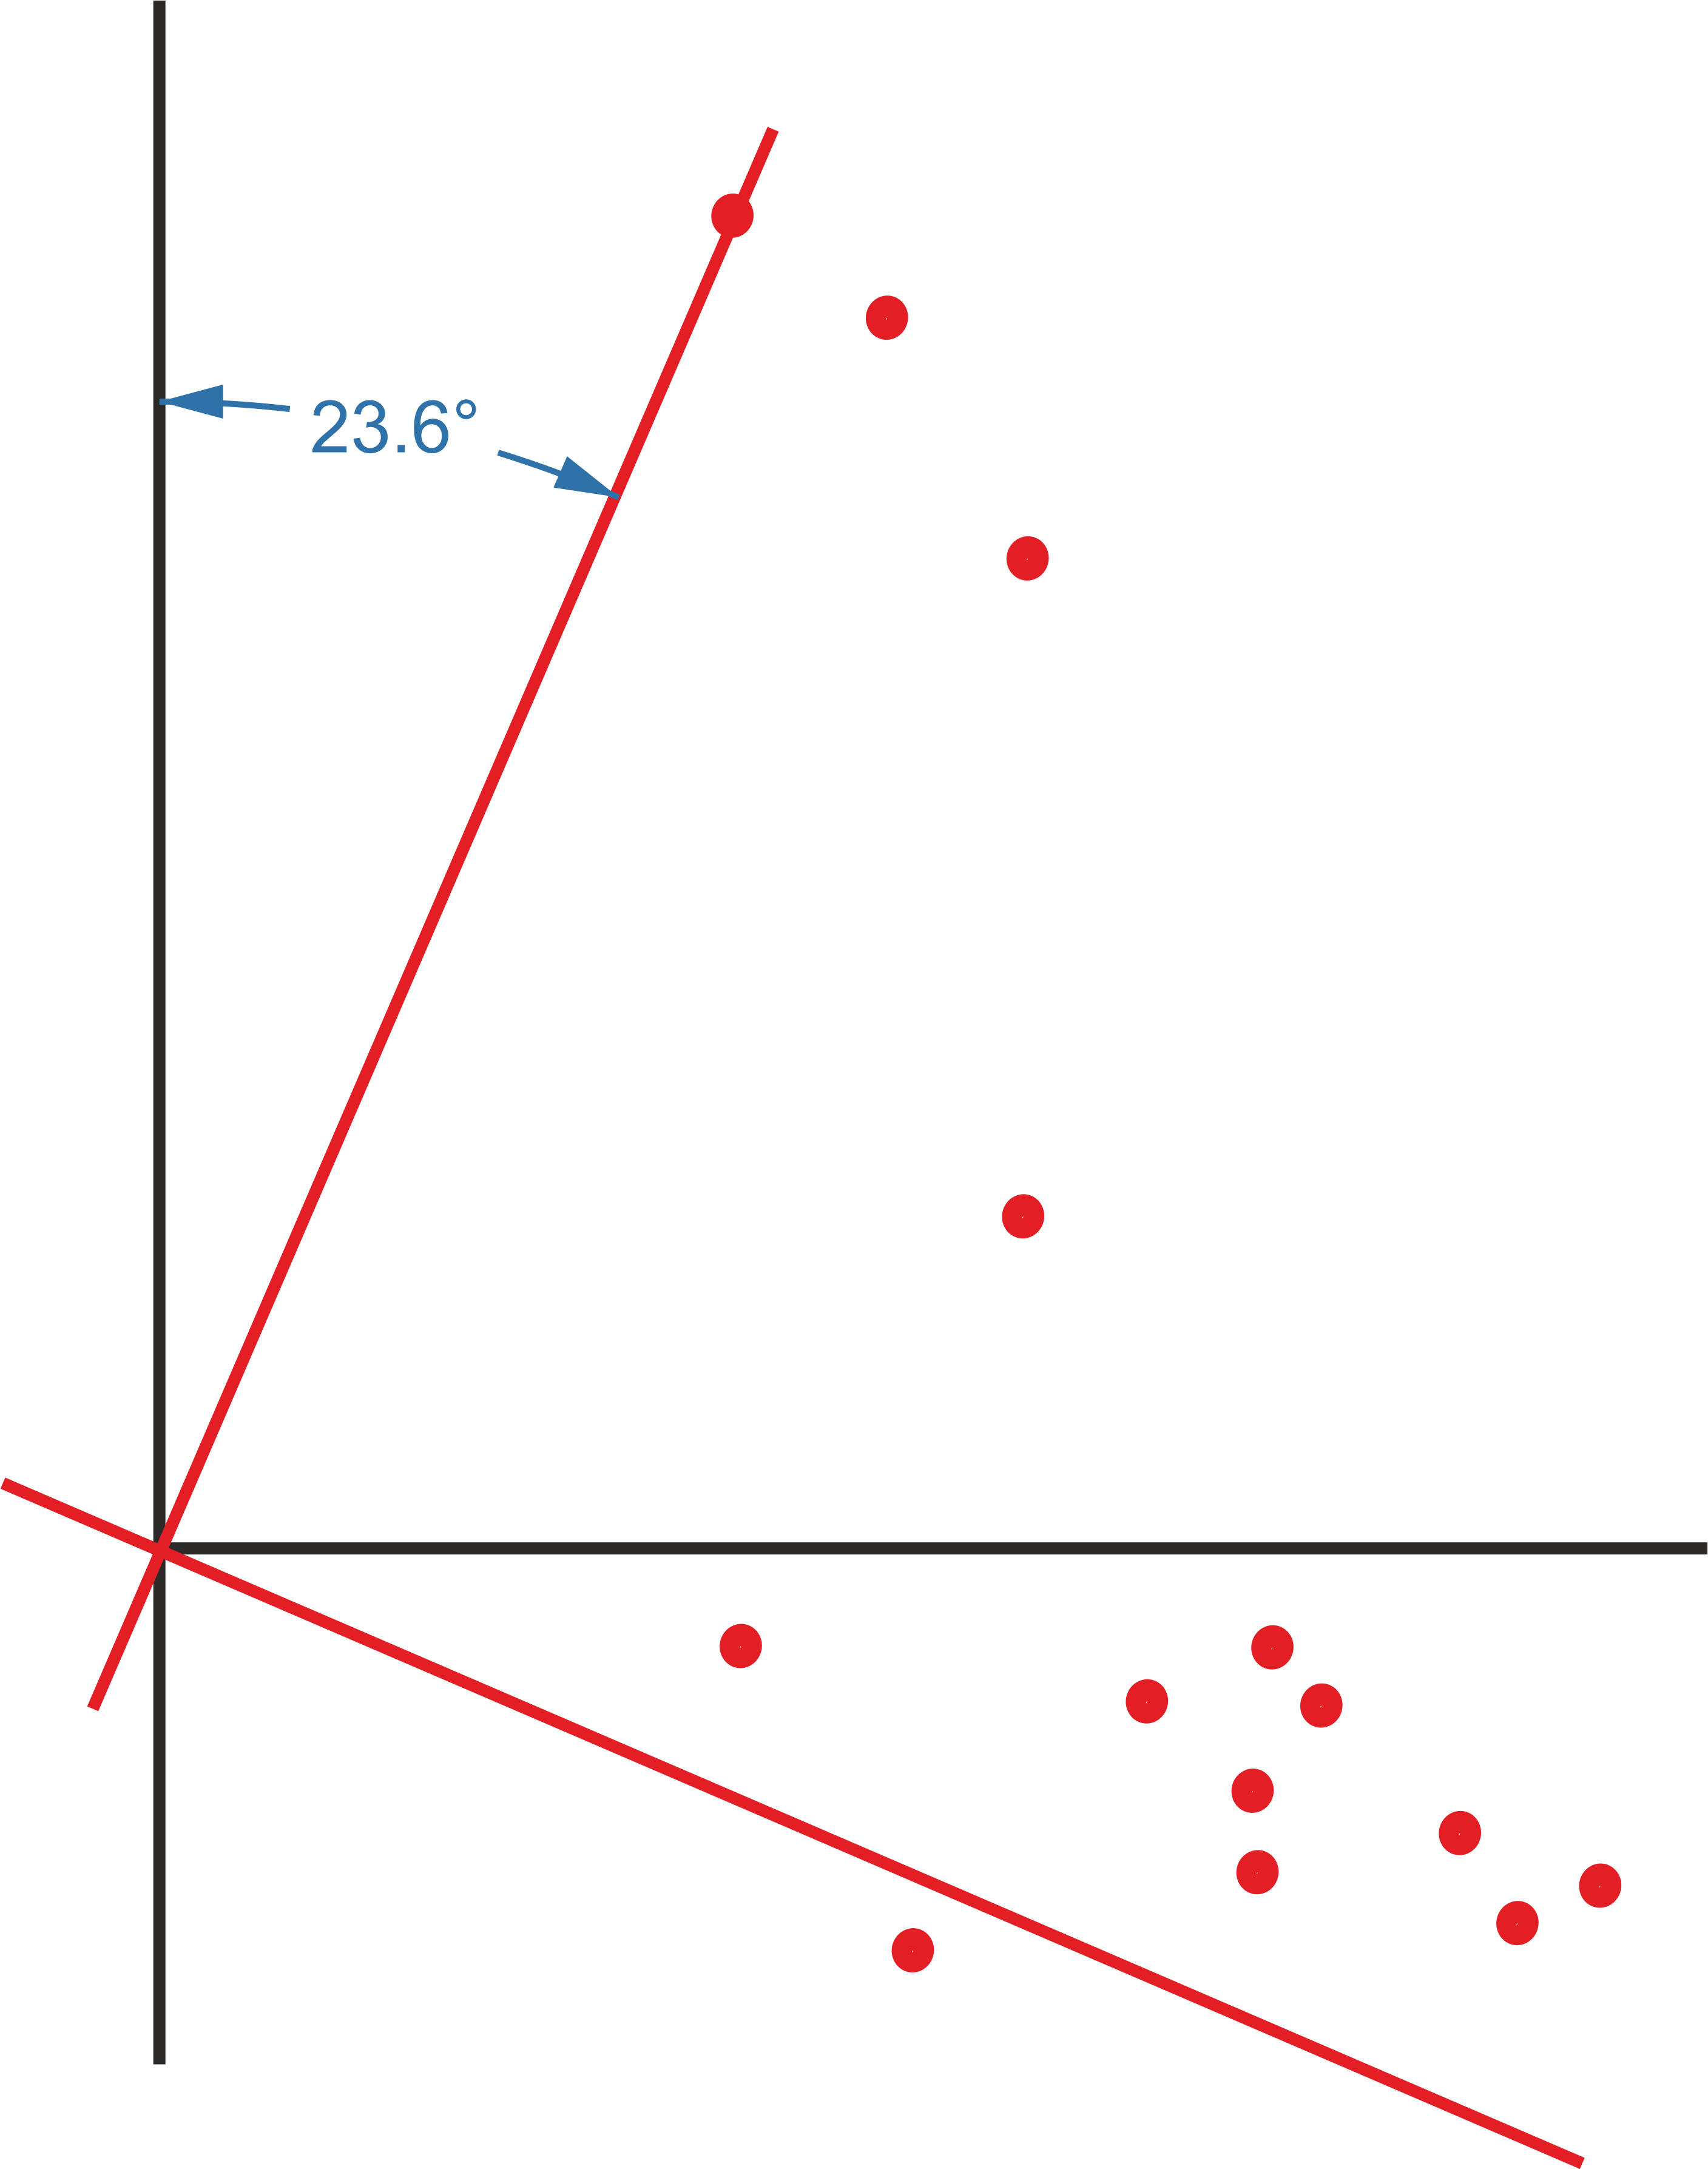
The value of the Venn diagram is that is shows the two components do not overlap. They have no variance in common, and so do not correlate; they are orthogonal, and account for unique and separate variance in the correlation matrix whether they are the extracted components or the orthogonally rotated components. Table 3 shows how the components were transformed by rotation. The main diagonal specifies the change in the relevant component as a correlation, so we can see that, for both Components 1 and 2, the extracted hypothetical variable loadings correlated .92 with the rotated loadings. We can turn a correlation into an angle of rotation -- the correlation is the cosine of the angle concerned. A cosine of .92 corresponds to an angle of 23.6°, this is illustrated in Figure 7. (We remember high school geometry, of course.... Cos(90) = 0, two lines at right angles, correlate r = 0.0, and Cos(0) = 1, two lines which overlap, correlate perfectly, r = 1.0.) The off-diagonal elements specify the redistribution of variance accounted for between the components. These are correlations, so squaring them tells us the % of change in the variance accounted for. To check, then, (.92)2 + (.40)2 = 100% and (.92)2 + (-.40)2 = 100%. Yup, all redistributed variance accounted for.
Table 3. Component Transformation Matrix
Figure 7. Angle of rotation
Some details on rotationRotation is calculated by an iterative algorithm, and there is a variety of rotation algorithms. The most common orthogonal rotation algorithm is "Varimax". It is an implementation of the concepts of coupling and cohesion, where the component axes are rotated in small increments, and at each increment the algorithm checks if the cohesion of the variables on each component has increased. The algorithm terminates when no further improvement in cohesion is seen. The cohesion of the variables loading on a component is measured by the variance of the variances (the squared loadings) accounted for by the component, and Varimax seeks a maximum. This occurs when some of the variables show high loadings and other variables show small loadings. Any rotation almost certainly requires "Kaiser Normalization" and this option should be routinely specified. Normalization scales component loadings by the square root of the variable's communality. This weights each variable equally so that variables with high communalities (and hence high loadings) do not disproportionately dominate the rotated solution.
Interpreting rotated componentsTable 4 shows the rotated components. For comparison, Table 5 shows the components as extracted (from the introduction to PCA). The rotated components show a cleaner structure, where Support for online participation loads substantially on Component 2 rather than on both components.
Table 4. Rotated component matrix sorted and edited
Table 5. Extracted component matrix sorted and edited
While the two clusters of variables seem to have been more clearly identified with orthogonally rotated components, there still remains the relative difficulty of interpreting Component 1 which incorporates a variety of themes. We therefore examine a rotation scheme which relaxes orthogonality and constructs rotated components which are oblique -- they are correlated. Thereafter, we examine a four component analysis, as suggested by the rule of thumb to extract components with Eigenvalues greater than 1. After these two excursions, we go back to the beginning of a factor analysis and examine an extraction scheme called Principle Axes, also known as exploratory factor analysis. This starts with a correlation matrix with a main diagonal composed of the maximum communality for each variable, rather than a self-correlation of 1. It is most likely that (all) your factor analysis will be Principle Axes rather than PCA. And components will be called factors.
| |||||||||||||||||||||||||||||||||||||||||||||||||||||||||||||||||||||||||||||||||||||||||||||||||||||||||||||||||||||||||||||||||||||||||||||||||||||||||||||||||||||||||||||||||||||||||||||||
|
©2025 Lester Gilbert |