



|
|
|
These are the pages relevant to the topic of factor analysis: Regression. This page, Introduction to principal components analysis. Orthogonal factor rotation. Oblique rotation. Full factor extraction. Principle Axes extraction. Cluster analysis.
Factor analysis: Introduction to PCA extractionWe have a correlation matrix, being the measures of association between a number of variables, and we are interested in its underlying structure, that is, how might we account for the associations. For example, the 16PF is a theory that people's responses to 185 questions (and consequent matrix of 34,040 correlations) can be accounted for by 16 distinct personality factors (https://en.wikipedia.org/wiki/16PF_Questionnaire). The 10 or 12 questions which show respondents to be trusting or distrustful, unsuspecting or suspicious, accepting or skeptical, and so on, have high inter-correlations and cluster on a 16PF factor called "Vigilance". These questions show low correlations with other questions, such as those which show respondents to be serious or lively, prudent or spontaneous, taciturn or expressive, and so on, which have high inter-correlations with themselves and cluster on a separate 16PF factor called "Liveliness". Factor analysis identifies factors -- clusters of variables -- such that the variables within a cluster are more highly associated and are less associated with variables in other clusters. Computer scientists may recognise the parallels with programming, where a code module ideally shows high internal cohesion and low coupling with other modules. We begin with a specific example, using data from a research project investigating the variables which support individual online commerce. Participants completed a survey which asked about their online and commercial abilities and experiences. The correlation matrix is shown in Table 1. Our research question is what factors underlie the observed pattern of inter-correlations of the 14 variables. Table 1. Correlation matrix
As is usual with a correlation matrix, it is more or less impossible to eye-ball the 182 individual correlations in Table 1 and make any sense of them. The key idea of factor analysis is to construct hypothetical factors, each a unique combination of the 14 variables, such that these factors account for a "maximum" of the observed co-relationships. More technically, a factor is that weighted combination of the variables which maximally accounts for the variance seen in the correlation matrix.
Factor extraction -- first factorWe begin by constructing our first factor using the method of "Principle components analysis", PCA for short; we'll explore the technical details later. We ask SPSS (or your statistics software of choice) to extract one component (§1) from our correlation matrix. Tables 2, 3, and 4 and Figure 1 show the initial output -- Communalities, Variance explained, Component matrix, and Scree plot. (§1) A component is, loosely speaking, a factor. Call it "factor" if you like while reading, that's OK. But it should be "component" in your results write-up.
Table 2. Communalities (h2) after 1 component extracted
The term "communalities" derives from the word "common", and the table of communalities is a table of the total amount of variation that each variable has in common with the component(s) extracted. Note that communality is symbolised "h2", reminding us that the table entries are squared, that is, that they express variance accounted for. Initial h2 is 1.0 for each variable, which is what we would see in the main diagonal of a usual correlation matrix, being the correlation of the variable with itself, r = 1.00. This is the key feature of PCA, which starts with 1.00 in the main diagonal of the correlation matrix. Then, after the component(s) have been extracted, we may read h2 after extraction, being what the variable has in common with the component(s) that have been extracted.
Table 3. Total variance explained
We have extracted the first component which accounts (§2) for 35.75% of the variance seen in the correlation matrix of Table 1. Table 3 reports the first of the technical expressions we will see in factor analysis -- that the initial Eigenvalue of component 1 equals 5.00. Table 3 shows us that we could extract further components, up to a maximum of 14. Of course, 14 components would account for 100% of the correlation matrix because there are 14 variables. If we were to extract a second component, it would have an Eigenvalue of 1.73 and account for a further 12.35%, and so on for further components. An early question, then, is how many components should be extracted? And, what is an Eigenvalue? We'll get to that in a moment. (§2) The table title uses the word "explained", which is common in discussions of regression and factor analysis, so it is left as found in SPSS output. Strictly speaking, however, it is incorrect. A component "explains" nothing because it is a figment of a statistical calculation. Only an experiment can "explain" something, and that only if it has been properly constructed with an appropriate protocol to do so. An observational study is only able to explain something if there is a water-tight and compelling logic which turns a variable that is associated with another variable into a variable which "explains" that other variable.
Table 4. Component matrix
Table 4 provides the weightings of each variable towards the first hypothetical component which maximally accounts for the variation seen in the correlation matrix. In factor analysis, these weights are called "loadings". They are analogous to the Beta weights seen in regression analysis, and are of the same form, being interpreted as correlation coefficients. Given that a loading may be interpreted as a correlation, its square may be interpreted as a % of variance accounted for. Table 5 shows these. Wait! We've seen these values before -- they are (more or less) identical to the communalities of Table 2. Not too much of a surprise -- what the variables have in common with the single extracted component, their communalities, is given by their loadings on the component. And, Wait! again. When we add up the squared loadings of the component, we obtain its Eigenvalue. So that is another small mystery solved.
Table 5. Component 1
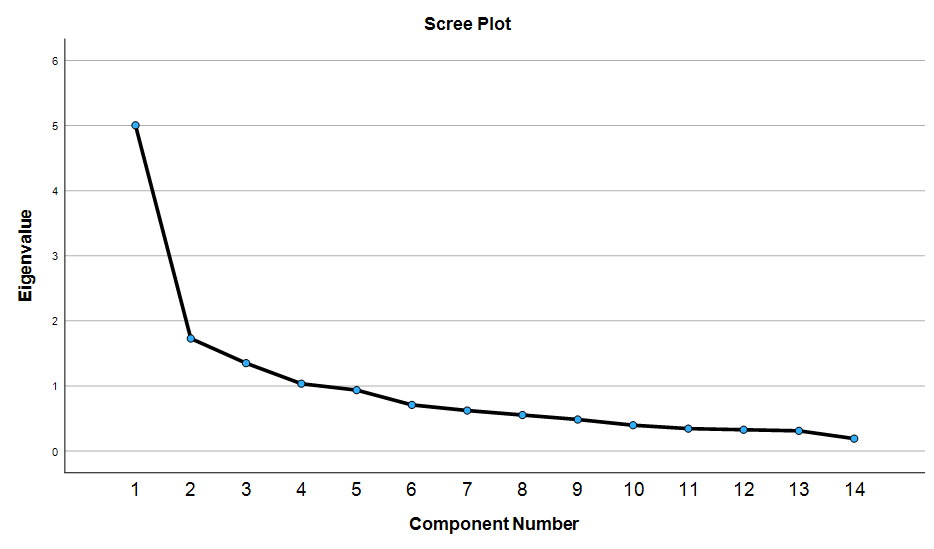
How many factors to extract?A component's Eigenvalue is the sum of its squared loadings, being the total variance it accounts for. The generally accepted rule of thumb in factor analysis is that a component with an Eigenvalue greater than 1 is "useful", and that is the default setting in SPSS for the number of factors to extract. Figure 1 shows the "Scree plot" of the initial Eigenvalues for up to the 14 components which could be extracted. (Scree is the rubble of rocks at the bottom of a mountain side. Nothing of interest there if it is the shape of the mountain side that interests us.)
Figure 1. Scree plot of component Eigenvalues
We recall that a component is that linear combination of the variables which account for variance in the correlation matrix. The second, third, etc, components extracted represent variance not yet accounted for, and this unique variance not yet accounted for falls off as more components are extracted. We may recall a similar situation in multiple linear regression, where each IV added to the regression equation accounts for unique variance left over from IVs entered earlier, which similarly falls off. The idea of the scree plot is to visually show this fall-off, and to suggest that component extraction should stop when the slope of the plot levels out and tends towards the horizontal -- that is, it represents rubble and not interesting mountain-side. We may note that MLR provides measures of statistical significance to help decide whether a variable significantly contributes to the regression equation, but there are no such aids in factor analysis to decide which components significantly contribute. While there are potentially four components with Eigenvalues greater than 1, and hence 4 components that could be "usefully" extracted, the scree plot suggests that the horizontal scree starts after component 2, and that only 2 components are "worth" extracting. The third approach to deciding the number of components to extract, entirely acceptable under a banner of exploration, is to successively extract 2, 3, 4, etc, components, interpret the 2 component solution, the 3 component solution, and so on, and to employ that interpretation and that number of components which seems to best answer the research question. We'll look at this issue again when we define "exploratory factor analysis".
Interpreting component 1What does Component 1 tell us about the underlying structure of the correlation matrix? The answer is to examine the variables with the highest loadings on the component, and to make some sense of what they have in common. To help with this, it is usual to (1) order the loadings from largest to smallest, and (2) omit small loadings from a table so that the "significant" loadings, and the "significant" variables relating to the factor, stand out. Two points. Table 5 shows loadings smaller than 0.4 omitted from the "significant" column, and this is a common convention. Some authors suggest 0.3 as the cut-off instead; the exact number does not normally matter, but must be declared. The second point is that the word "significant" is in quotes. A loading above 0.4 or 0.3 is NOT statistically significant; but it is instead usually considered practically important (§3). We will use the term "substantial" in what follows. (§3) See the discussion of effect size in the overview of Regression.
Table 6. Component matrix sorted and edited
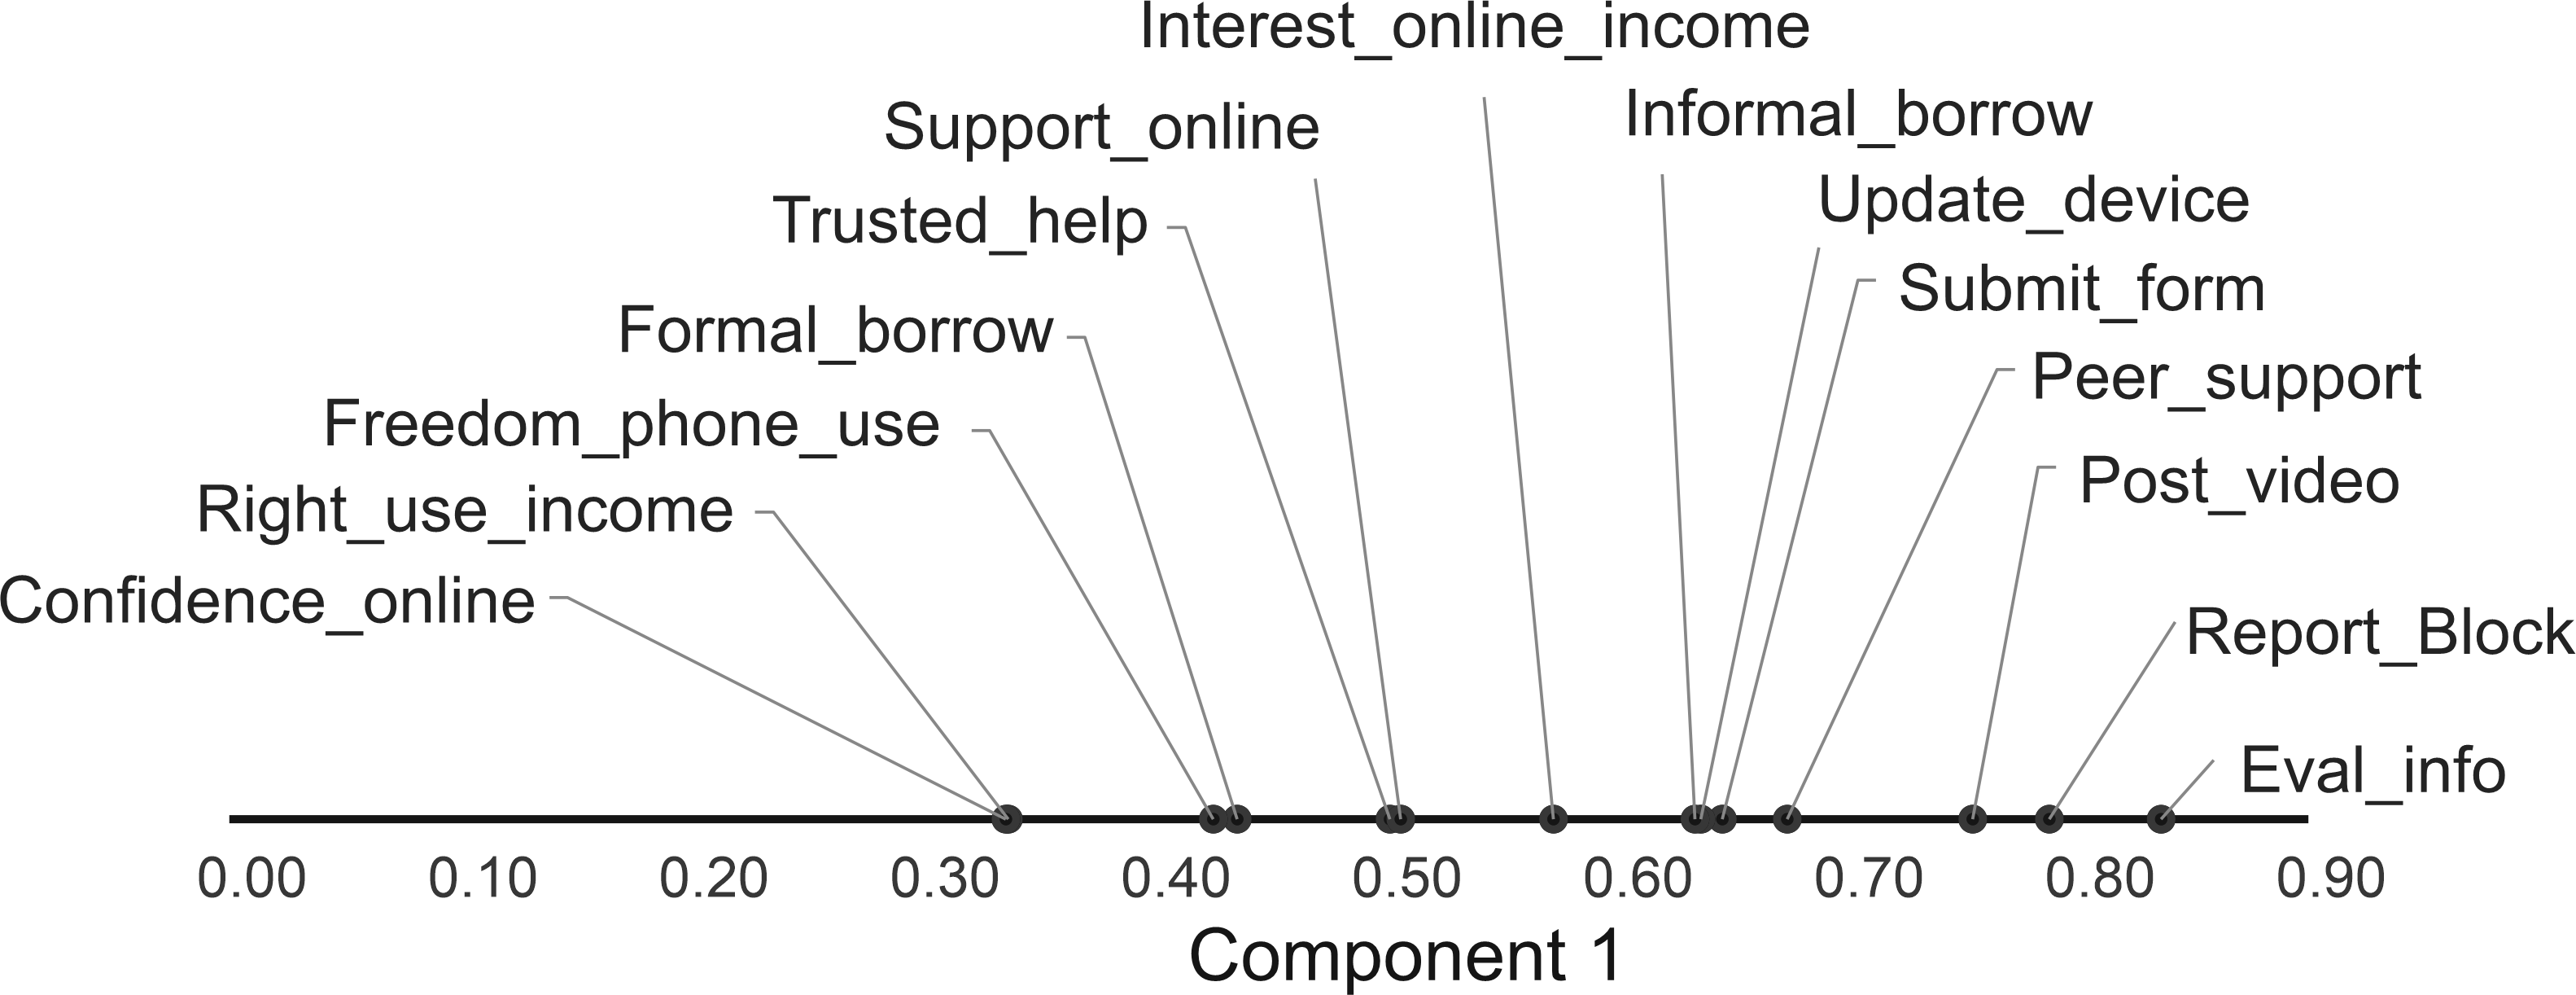
The interpretation of Component 1 is not immediately obvious. The 10 highest loading variables -- a loading of 0.5 or higher is considered "high" -- seem to involve a combination of trust, online capability, and social support. We need, at least, to extract a second component. Not being able to give a satisfactory interpretation of a factor analysis comprising just one component is entirely common. Figure 2 illustrates the loadings of the variables on the Component 1 axis.
Figure 2. Loadings plot of Component 1
Factor extraction -- second factorWe ask SPSS (or your statistics software of choice) to extract the second component from the correlation matrix. Tables 7, 8, and 9 show this output -- Communalities, Variance explained, and the Components matrix. The scree plot remains unchanged.
Table 7. Communalities (h2) after 2 components extracted
The communality of some variables has only increased slightly, while others have increased substantially. For example, Confidence online has increased from h2 = .11 to h2 = .71, while Submit forms is unchanged at h2 = .42. Considering that Component 2 is that linear combination of variables which account for variance not accounted for by Component 1, we may anticipate that Confidence online will load highly on Component 2.
Table 8. Total variance explained
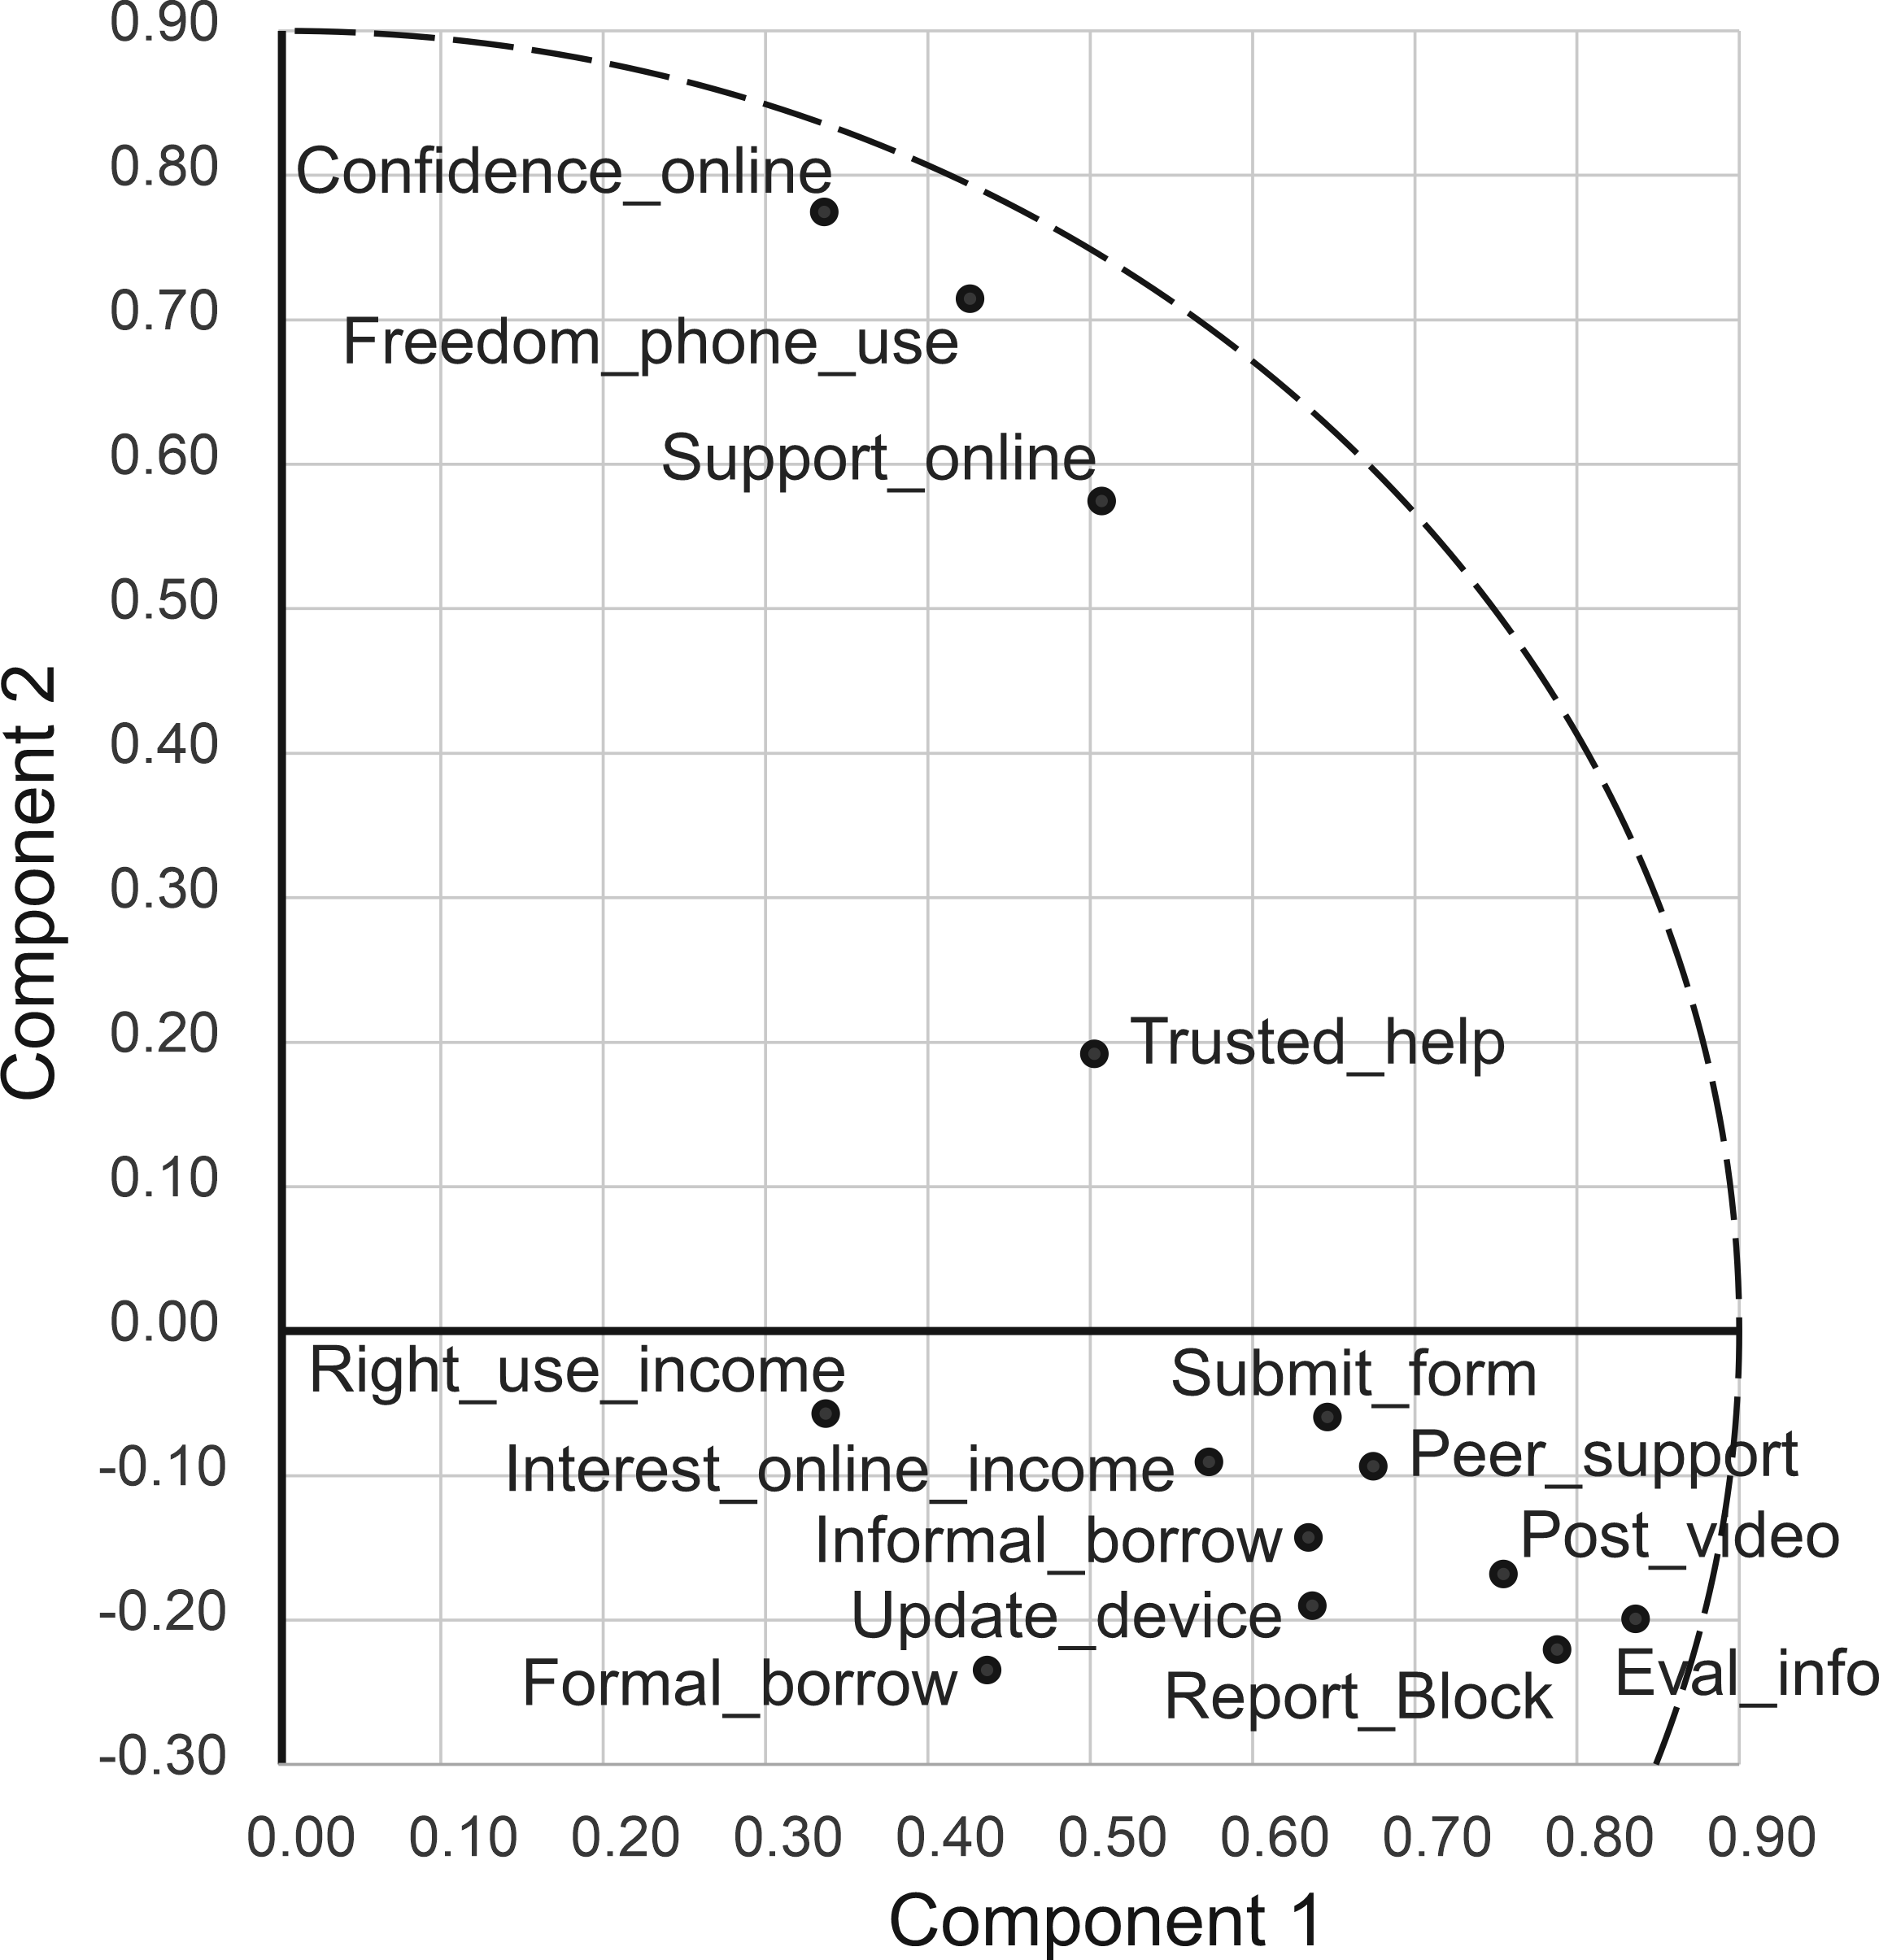
Table 8 adds information about Component 2 to Table 3, where we saw that Component 2 with an Eigenvalue of 1.73 would add a further 12.35% to the variance accounted for. Table 9 shows the loadings for the two components extracted so far. Component 1 loadings have not changed, while three variables now load substantially on Component 2. The other Component 2 loadings are mainly insubstantial and mainly negative. Because they are insubstantial, whether they are negative or positive is of little concern or interest.
Table 9. Component matrix
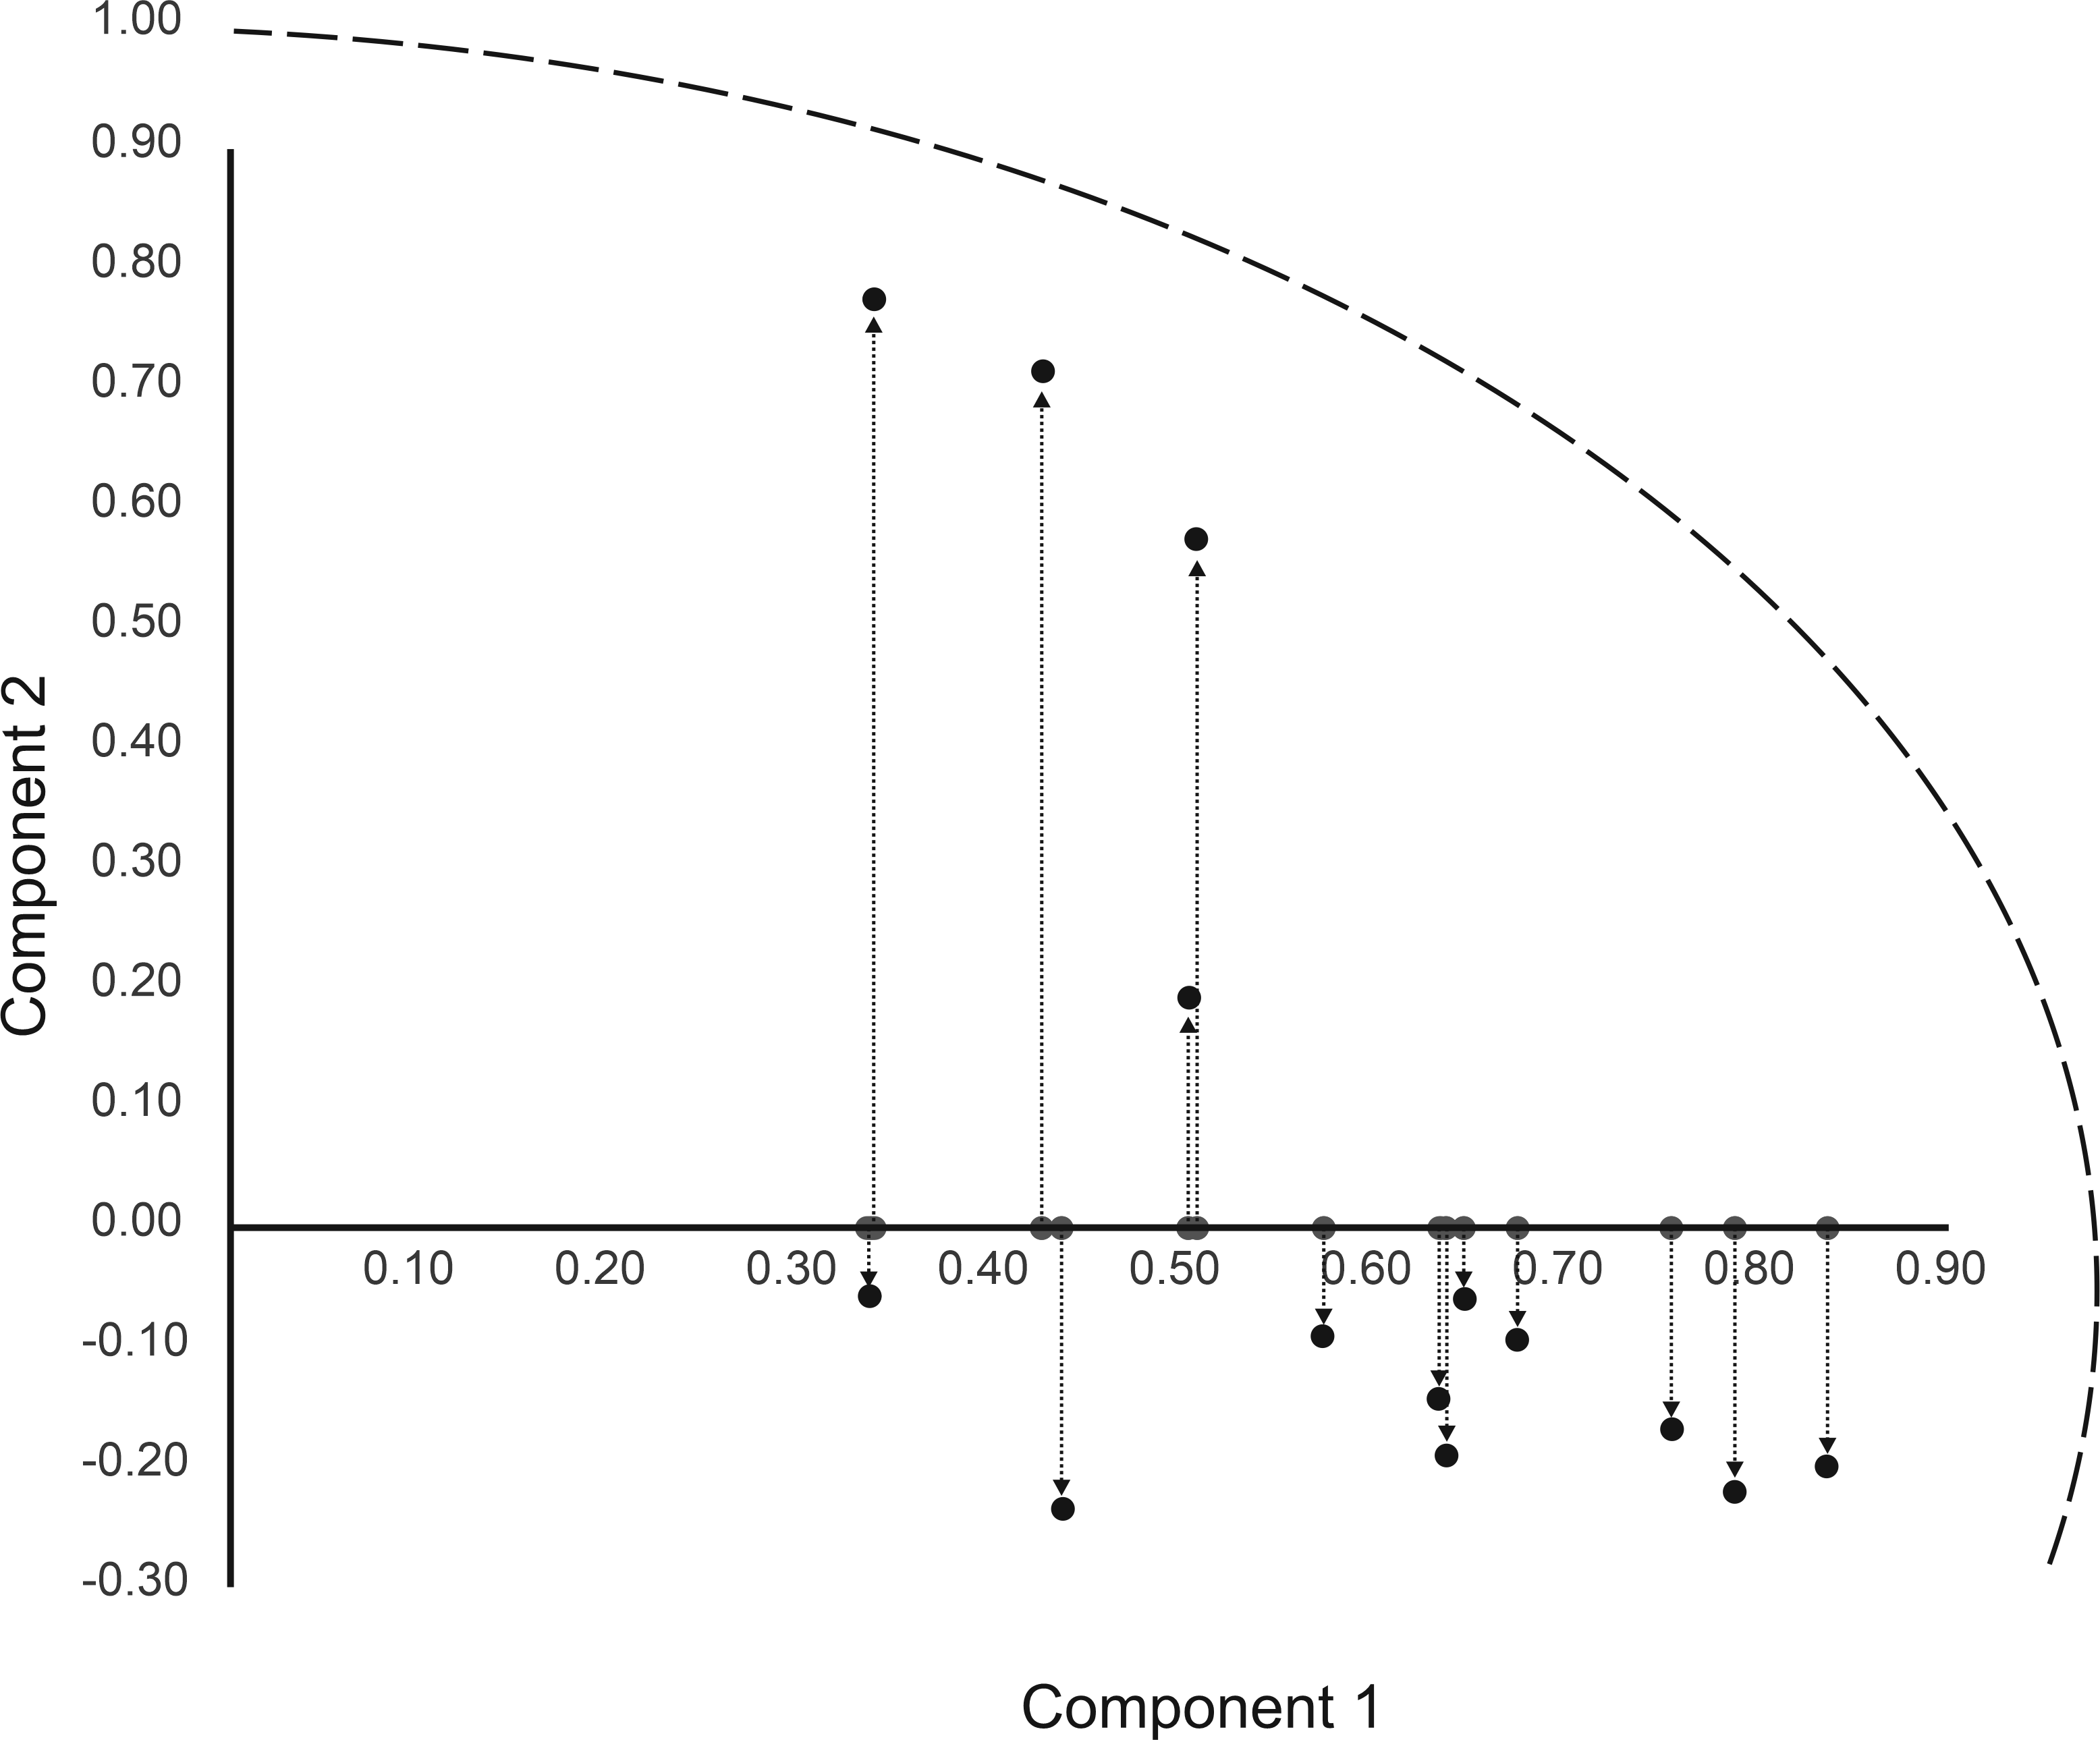
Figure 3 schematically illustrates the extraction of Component 2 from the variance left over after the extraction of Component 1. Three variables in particular have been "pulled off" from Component 1 to give the substantial loadings shown in Table 9. The dashed line shows the limit to which a variable can be "pulled off" -- variables already loading highly on Component 1 have little scope to also load highly on Component 2, since Component 2 accounts for variance not accounted for by Component 1. On the other hand, it is variables with small loadings on Component 1 which have variance unaccounted for by Component 1 and which therefore have higher scope to load on the next component to be extracted.
Figure 3. Schematic loadings plot illustrating extraction of Component 2
Note that the loadings of variables on Component 2 are "pulled off" at right angles -- orthogonal -- to Component 1. The two components -- two hypothetical variables -- have a correlation of exactly zero by definition. Figure 4 provides the annotated plot of loadings.
Figure 4. Annotated loadings plot of Components 1 and 2
Interpreting components 1 and 2Table 10 shows the state of the factor analysis so far, listing the extracted components in order of loadings, and leaving blank loadings below 0.40. As before, we examine the variables with the highest loadings on the components, and make some sense of their cohesion on their component and the lack of coupling of the components themselves.
Table 10. Component matrix sorted and edited
As before, the interpretation of Component 1 remains non-obvious. It seems to involve a combination of trust, online capability, and social support, but we may see that the three variables loading substantially on Component 2 also involve online capability and social support. Not being able to give a satisfactory interpretation of extracted components is entirely common. The next page introduces factor analysis' "super power" -- factor rotation.
| ||||||||||||||||||||||||||||||||||||||||||||||||||||||||||||||||||||||||||||||||||||||||||||||||||||||||||||||||||||||||||||||||||||||||||||||||||||||||||||||||||||||||||||||||||||||||||||||||||||||||||||||||||||||||||||||||||||||||||||||||||||||||||||||||||||||||||||||||||||||||||||||||||||||||||||||||||||||||||||||||||||||||||||||||||||||||||||||||||||||||||||||||||||||||||||||||||||||||||||||||||||||||||||||||||||||||||||||||||||||||||||||||||||||||||||||||||||||||||||||||||||||||||||||||||||||||||||||||||||||||||||||||||||||||||||||||||||||||||||||||||||||||||||||||||||||||||||||||||||||||||||||||||||||||||||||||||||||||
|
©2025 Lester Gilbert |