![]()
![]()
![]()
![]()
![]()
![]()
|
|
|
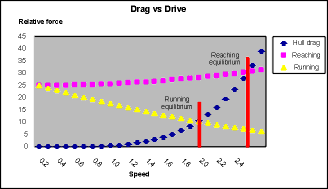
Hull dragThe spreadsheet starts by approximating total drag. This is given as the sum of wave-making drag and skin friction drag. The fourth power of hull speed approximates wave-making drag. A scaled factor of the square of hull speed approximates skin friction drag. The exponents can be changed. For wave making drag, you can use a number different from 4 if you prefer; some folks prefer 3. For friction drag, most folk are happy with 2. The scale factor for friction is set to "3" in the spreadsheet, but again you can change this if you like. All it does is balance the friction drag, dominant at low boat speeds, against the wave making drag, dominant at higher boat speeds. You want enough friction drag to make sure that the boat won't sail faster than the wind! The total drag shows on the graph as the "Total" line, in light blue here. As you can see, it starts low, but climbs steeply. Note that the boat "speed" is also not intended to be realistic, just approximately indicative.
Sail driveThen the spreadsheet calculates sail drive. The graph illustrates what happens, in general terms, when the wind speed is set to a value of "5" in the spreadsheet. This wind speed is just a number, and is not intended to be realistic. In the case of beating or reaching, the drive is taken as the square of the apparent wind speed. Apparent wind speed increases as the boat gains forward motion while on the wind, and the spreadsheet assumes a beam reach to make the arithmetic simple. For a beam reach, Pythagoras' Theorem gives the apparent wind as the square root of the sum of the boat speed squared plus the true wind speed squared. The drive from the sails while reaching is shown on the graph as the gently rising purple line. The exponent for drive while on the wind can be changed to a number different from 2 if you prefer, but 2 is generally taken to be right. In the case of running, the drive from the sails is also taken as the square of the apparent wind, but here the apparent wind decays as the boat picks up speed. The apparent wind on the run is the difference between the true wind, and the boat speed. The drive while running is shown on the graph as the decaying yellow line. The exponent for drive while off the wind can be changed to a number different from 2 if you prefer, but 2 is generally taken to be right. The drive from the sails while on the run is in fact given by the drag of the sails, whereas the drive of the sails while beating or reaching is given by the lift generated by the sails. The coefficient of drag on the run is around 1.8 or 1.9, while the coefficient of lift is around 1.3 or 1.5. This just means that the drag force is 40% or 50% greater than the lift force for a given apparent wind speed. The spreadsheet takes account of this by scaling up the drive force from the sails on the run in the ratio of the coefficients involved.
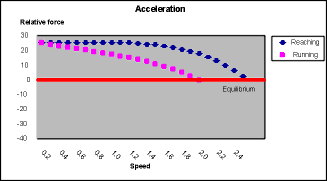
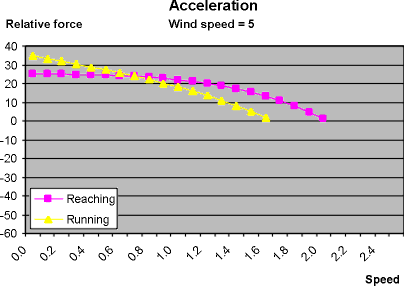
The graph plots the sail drive against the total hull drag. The end result, the actual speed of the boat, occurs when the sail drive force matches the hull drag. This equilibrium is shown on the graph as being around a speed of 2.1 when on the wind, and around a speed of 1.7 when off the wind. This is just another way of saying that a beam reach is the fastest point of sailing. Remember, these speed numbers don't mean anything in themselves. They are just relative numbers used to illustrate the physics involved. But if you'd like to think they mean "metres per second", for an IOM, you won't be too far out. This graph also illustrates why the spreadsheet is a very simple VPP. It takes total drag and compares that against total drive and finds the boat speed where the drag and drive exactly balance. Total drag is made up of two components: friction drag, and wave-making drag. Drive depends upon whether the sails are generating lift, on the wind, or are acting simply as flat drag plates, off the wind. AccelerationThe next graph shows the accelerative force available to the boat as it picks up speed from rest. Again, this illustration is for a wind speed of 5.
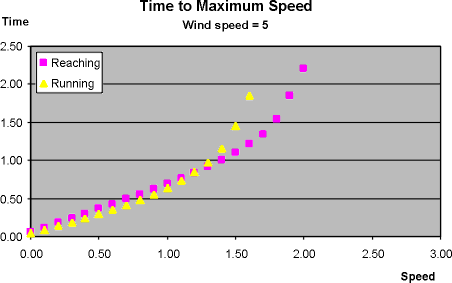
When on the wind, the graph shows that the accelerating force while reaching, purple line, is pretty constant and at "maximum" for most of the time, only decaying shortly before reaching the equilibrium or maximum speed of the boat, at around a speed of 2.1. That is interesting; I hadn't appreciated just how much the boat was "at full throttle" when below maximum speed on the wind. By contrast, the accelerating force available off the wind while running, yellow line, decays as soon as the boat begins to move, and drops pretty steadily to the equilibrium or maximum speed of the boat while running, around a value of 1.7. I'd, um, managed to figure that out, at least... Notice that, initially, the spreadsheet says the available force to accelerate the boat is higher on the run early on that the force when reaching. This is because the drag coefficient of the sails on the run, about 1.8 or 1.9, is higher than the lift coefficient of the sails while reaching, around 1.3 or 1.5. So when the apparent wind speed is similar, there is more force from the sails on the run. However, as the boat builds up speed, the apparent wind speed increases gradually while reaching, but drops off significantly on the run. Time to maximum speedThe spreadsheet provides estimates of the relative time taken for the boat to get up to speed. For the example figures given here, the boat takes about 2.2 units of time to get up to a speed of around 2.1 on the reach, and takes about 1.9 units of time to get up to a speed of around 1.7 on the run. Another way of looking at it is to notice that the spreadsheet estimates the boat will reach a speed of 1.4 in just about 1 unit of time on the reach, but will take about 1.2 units of time to do this on the run. These units of time are also arbitrary; but if you think of them as "seconds", that'll be OK. The spreadsheet provides a multiplier for the time units, currently set at 15, that you can change as needed to get something approximately correct for your boat.
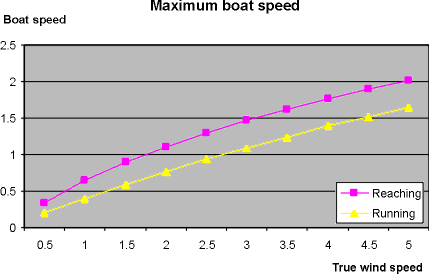
So as we know, wiggling your rudder, while tacking say, and losing speed while on the wind isn't such bad news, because there is excellent sail drive available to bring the boat back up to maximum. But wiggling your rudder on the run, while gybing say, is not good news, because in general there is less than half of the sail drive available to bring the speed back up, and getting back up to maximum thus takes relatively longer. Max speed for different wind strengthsThe next two graphs show the results from the spreadsheet when it is used for a range of wind speeds. This graph and the next are done by hand, at the bottom of the first page of the spreadsheet. Here I've plotted the maximum speeds. If you like to explore this in more detail, the process is automated with a macro on the VPP spreadsheet.
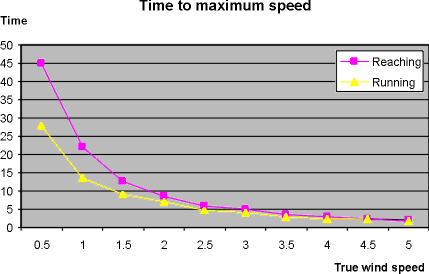
In this graph, I've plotted the time taken to achieve maximum speed.
It is clear that, for light winds, it takes longer to get up to maximum speed while on the wind, than it does when off the wind. Now that is kind-of counter-intuitive. Didn't we see earlier that, if anything, getting up to speed was quicker on the wind? Not really. When the wind speed was 5, for an IOM the top of No.1 rig, it took 2.2 seconds while reaching, instead of 1.9 seconds on the run. This graph shows that this difference is negligible. When the wind is up, it takes effectively the same time. You need to look at the spreadsheet figures to see what is going on. It turns out that getting up to the last fraction of maximum is what takes all the time. For example, with a wind speed of 0.5, getting to a boat speed of 0.32 on the wind, just below maximum, takes about 39 units of time, but getting to the top speed itself of 0.34 takes around 49 units. And getting to top speed takes less time on the run 'cos that top speed is much less than the top speed on the reach, so it is "easier" to get to. According to the spreadsheet, top speed on the run in these conditions is about 0.20, and getting there takes about 29 units of time; but on the wind, getting to a speed of 0.20 takes only about 15 units... So as we know, when the wind is light, wiggling your rudder and losing speed is bad news both on and off the wind, because there is precious little sail drive available to bring the boat back up to her maximum. Bringing her up close to her maximum, now that's no problem; but that extra 5% faster than the competition? Ah, you've gone and lost it with that rudder movement. Some notes on using the spreadsheetSome 25 rows are given on the spreadsheet to cover the boat speeds of interest. The first row starts with a speed of 0, and then each subsequent row has the boat speed incremented by the value of "Increment", 0.1 in the case of the default spreadsheet. The spreadsheet estimates the maximum boat speed while reaching, and while running, by seeing when the difference between sail drive and hull drag goes negative. As long as the sail drive force exceeds the hull drag, the spreadsheets puts a "0" in the "near max" column. When hull drag overpowers sail drive, a "1" is entered. At the point where the last "0" occurs, and the first "1" occurs, the spreadsheet calculates a linear interpolation to estimate the maximum boat speed, the point where drive exactly balances hull drag. This interpolation is done in the column labelled "Est max speed". To calculate how much time is taken getting up to maximum speed, shown in the "Accum time taken" column, the spreadsheet crudely adds up the time taken to get to each increment of boat speed, shown in the "Time" column. This is highly approximate. To focus on lighter wind speeds, it is useful to set smaller values of the increment. For example, if wind speed is 0.5, then the increment would be set to 0.02, or 0.015, otherwise too few rows of the spreadsheet are used, and the roughness of the calculations becomes too apparent. Notice the dummy value of "1" at the end of the "Near max" column; this is to prevent calculation errors if the increment value is too small for the wind speed being used. The word "Error" shows in this case; increase the value of the increment until the error disappears. 2005-12-18 |
|
©2025 Lester Gilbert |